Feb 4
2018
Feb 11
Feb 18
Feb 25
Mar 4
Mar 11
Mar 18
Mar 25
Apr 1
0%
100%
200%
300%
400%
500%
Austin
Seattle
SF
Mean ClickThrough Rate before changing titles
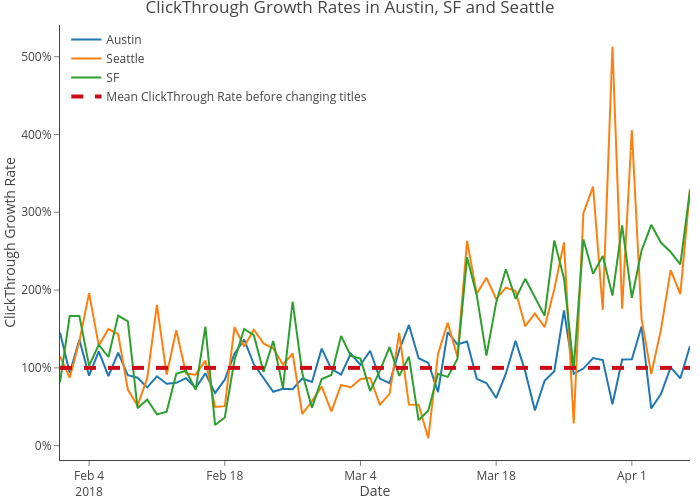
ClickThrough Growth Rates in Austin, SF and Seattle
Date
ClickThrough Growth Rate
plotly-logomark
Edit chart
Lethad's interactive graph and data of "ClickThrough Growth Rates in Austin, SF and Seattle" is a line chart, showing Austin, Seattle, SF, Mean ClickThrough Rate before changing titles; with Date in the x-axis and ClickThrough Growth Rate in the y-axis.. The x-axis shows values from 2018-02-01 to 2018-04-07. The y-axis shows values from -0.18433447979795425 to 5.4076552164338185.