Feb 4
2018
Feb 11
Feb 18
Feb 25
Mar 4
Mar 11
Mar 18
Mar 25
Apr 1
0%
200%
400%
600%
800%
1000%
1200%
1400%
Austin
Seattle
SF
Mean applications before changing titles
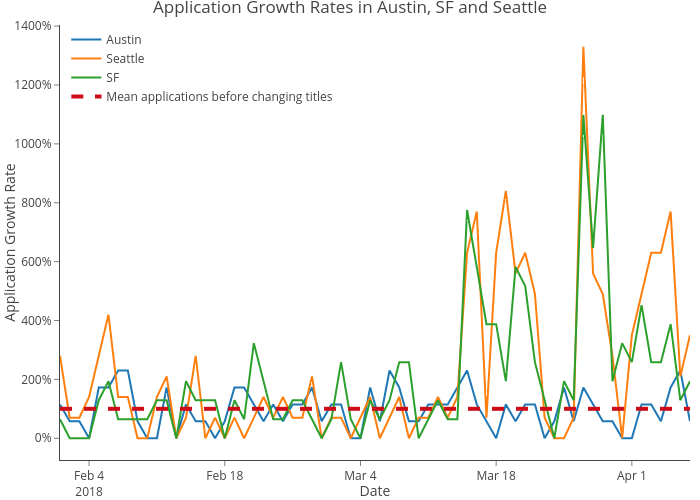
Application Growth Rates in Austin, SF and Seattle
Date
Application Growth Rate
plotly-logomark
Edit chart
Lethad's interactive graph and data of "Application Growth Rates in Austin, SF and Seattle" is a line chart, showing Austin, Seattle, SF, Mean applications before changing titles; with Date in the x-axis and Application Growth Rate in the y-axis.. The x-axis shows values from 2018-02-01 to 2018-04-07. The y-axis shows values from -0.7388888888888888 to 14.03888888888889.