2012
2013
2014
2015
2016
2017
2018
8k
9k
10k
11k
12k
13k
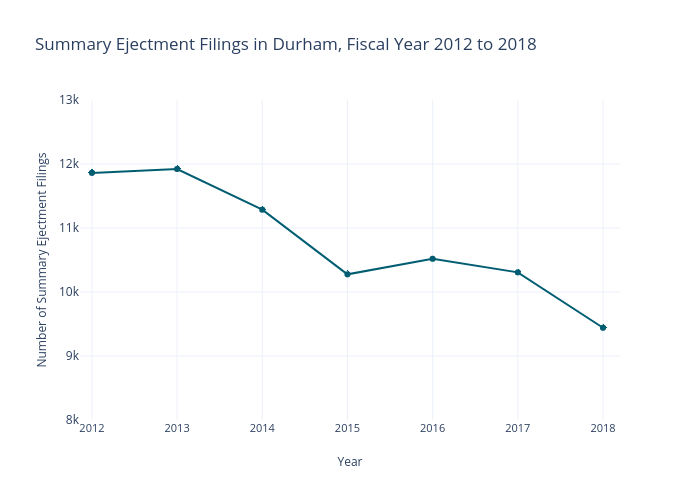
Summary Ejectment Filings in Durham, Fiscal Year 2012 to 2018
Year
Number of Summary Ejectment Filings
plotly-logomark
Edit chart
Kjimenez's interactive graph and data of "Summary Ejectment Filings in Durham, Fiscal Year 2012 to 2018" is a ; with Year in the x-axis and Number of Summary Ejectment Filings in the y-axis.. The x-axis shows values from 2011.86 to 2018.2. The y-axis shows values from 8000 to 13000.