0
5k
10k
15k
20k
25k
30k
35k
40k
2
4
6
8
10
12
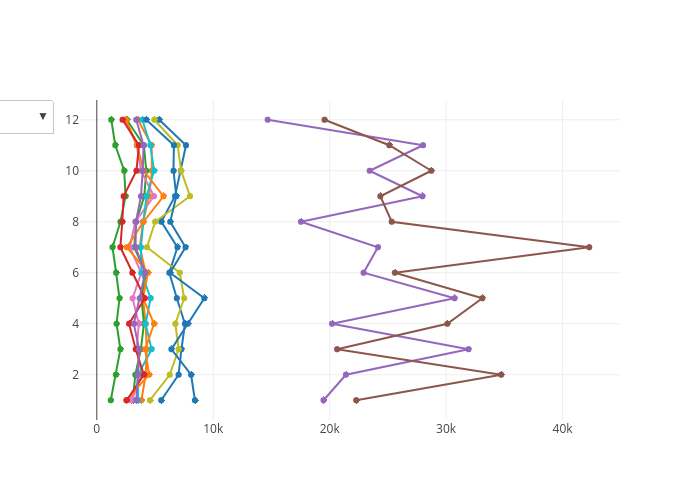
Average Amount raised per Campaign Category in its Most popular Months
Average Amount raised
Month of the Year
▼
plotly-logomark
Edit chart
Katba-caroline's interactive graph and data of "Average Amount raised per Campaign Category in its Most popular Months" is a line chart, showing Film Campaigns launched since 2009 Per Month, Music Campaigns launched since 2009 Per Month, Publishing Campaigns launched since 2009 Per Month, Games Campaigns launched since 2009 Per Month, Technology Campaigns launched since 2009 Per Month, Design Campaigns launched since 2009 Per Month, Art Campaigns launched since 2009 Per Month, Food Campaigns launched since 2009 Per Month, Fashion Campaigns launched since 2009 Per Month, Theater Campaigns launched since 2009 Per Month, Comics Campaigns launched since 2009 Per Month, Photography Campaigns launched since 2009 Per Month, Crafts Campaigns launched since 2009 Per Month, Journalism Campaigns launched since 2009 Per Month, Dance Campaigns launched since 2009 Per Month; with Average Amount raised in the x-axis and Month of the Year in the y-axis.. The x-axis shows values from -1408.0229384876968 to 44897.223068822. The y-axis shows values from 0.2021189894050528 to 12.797881010594947.