0
1000
2000
3000
4000
5000
2
4
6
8
10
12
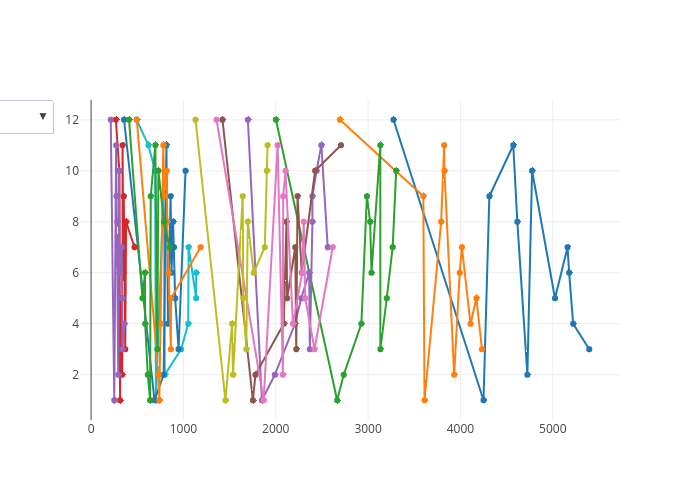
Campaigns' Most popular Months
Total Number of Campaigns in that Month since 2009
Month of the Year
▼
plotly-logomark
Edit chart
Katba-caroline's interactive graph and data of "Campaigns' Most popular Months" is a line chart, showing Film Campaigns launched since 2009 Per Month, Music Campaigns launched since 2009 Per Month, Publishing Campaigns launched since 2009 Per Month, Games Campaigns launched since 2009 Per Month, Technology Campaigns launched since 2009 Per Month, Design Campaigns launched since 2009 Per Month, Art Campaigns launched since 2009 Per Month, Food Campaigns launched since 2009 Per Month, Fashion Campaigns launched since 2009 Per Month, Theater Campaigns launched since 2009 Per Month, Comics Campaigns launched since 2009 Per Month, Photography Campaigns launched since 2009 Per Month, Crafts Campaigns launched since 2009 Per Month, Journalism Campaigns launched since 2009 Per Month, Dance Campaigns launched since 2009 Per Month; with Total Number of Campaigns in that Month since 2009 in the x-axis and Month of the Year in the y-axis.. The x-axis shows values from -115.71261107959907 to 5723.712611079599. The y-axis shows values from 0.2021189894050528 to 12.797881010594947.