2007
2008
2009
2010
2011
2012
2013
94
96
98
100
102
104
OBR estimates of GDP without austerity (FER 2014)
Jorda-Taylor estimates of GDP without austerity
GDP
The cost of austerity
Index of real GDP (2007=100)
plotly-logomark
Edit chart
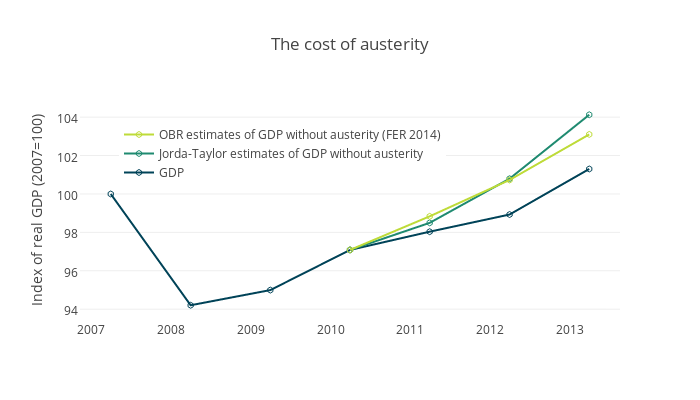
Jzuccollo's interactive graph and data of "The cost of austerity" is a scatter chart, showing GDP, Jorda-Taylor estimates of GDP without austerity, OBR estimates of GDP without austerity (FER 2014); with time in the x-axis and Index of real GDP (2007=100) in the y-axis.. The x-axis shows values from 1163124615047.022 to 1376858984952.978. The y-axis shows values from 93.43631558560368 to 104.89377604439632.