Aug 6
2017
Aug 13
Aug 20
Aug 27
Sep 3
Sep 10
0.025
0.03
0.035
0.04
0.045
0.05
0.055
0.06
0.065
0.07
StackOverflow
GitHub
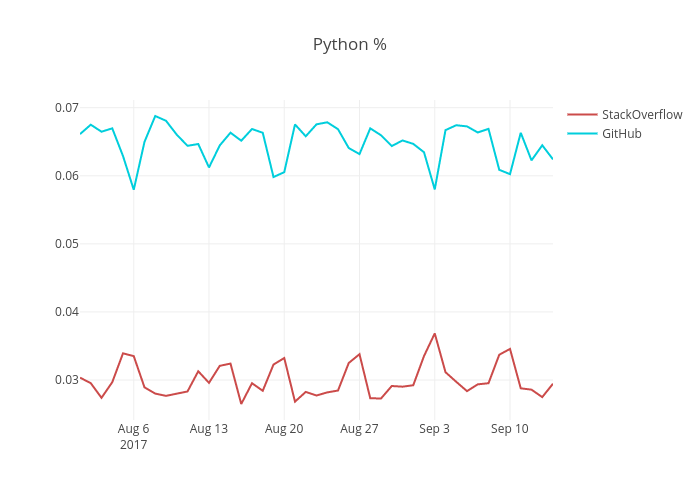
Python %
plotly-logomark
Edit chart
Jurajkapasny's interactive graph and data of "Python %" is a line chart, showing StackOverflow vs GitHub. The x-axis shows values from 0 to 0. The y-axis shows values from 0 to 0.