Aug 6
2017
Aug 13
Aug 20
Aug 27
Sep 3
Sep 10
50k
100k
150k
200k
250k
300k
Number of commits
Date
Number of commits
plotly-logomark
Edit chart
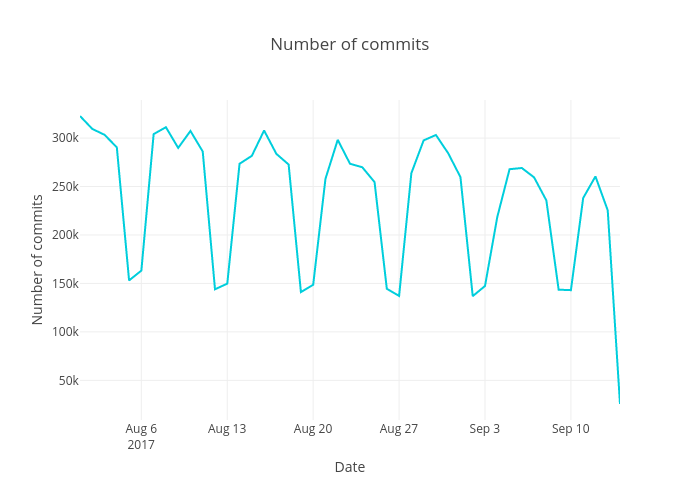
Jurajkapasny's interactive graph and data of "Number of commits" is a line chart, showing Number of commits; with Date in the x-axis and Number of commits in the y-axis.. The x-axis shows values from 0 to 0. The y-axis shows values from 0 to 0.