0
20
40
60
80
100
CIUDAD
AGUASCALIENTES
BAJA CALIFORNIA
BCS
CAMPECHE
COAHUILA DE ZARAGOZA
COLIMA
CHIAPAS
CHIHUAHUA
DISTRITO FEDERAL
DURANGO
GUANAJUATO
GUERRERO
HIDALGO
JALISCO
EDOMEX
MICHOACÁN
MORELOS
NAYARIT
NUEVO LEON
OAXACA
PUEBLA
QUERETARO
QUINTANA ROO
SAN LUIS POTOSÍ
SINALOA
SONORA
TABASCO
TAMULIPAS
TLAXCALA
VERACRUZ
YUCATÁN
ZACATECAS
Cobertura total de B.
Cobertura parcial de B.
Sin Cobertura de B.
N/A
Porcentaje de Manzanas y cobertura de banquetas por entidad
plotly-logomark
Edit chart
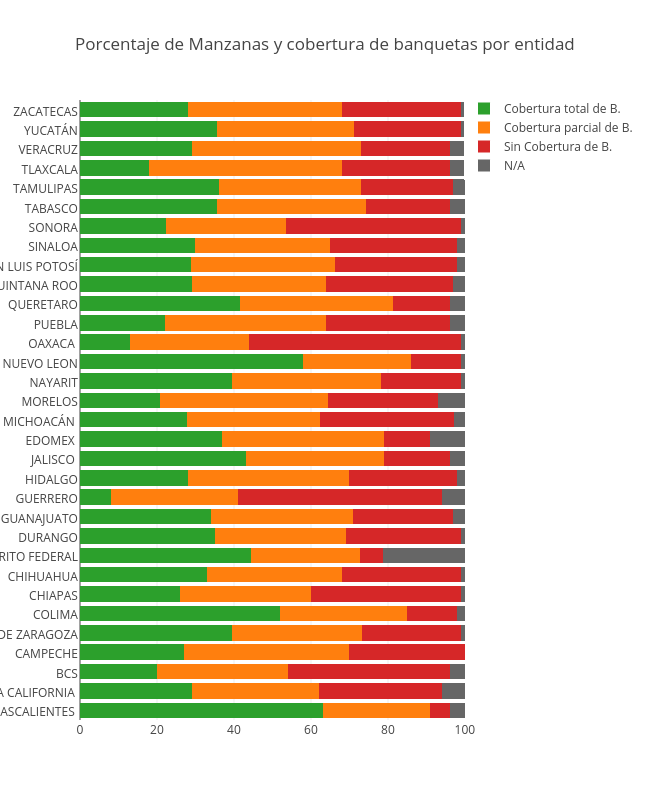
Jsmanuel.landin's interactive graph and data of "Porcentaje de Manzanas y cobertura de banquetas por entidad" is a stacked bar chart, showing Cobertura total de B., Cobertura parcial de B., Sin Cobertura de B., N/A. The x-axis shows values from 0 to 100. The y-axis shows values from 0.5 to 32.5.