2000
2005
2010
2015
10k
15k
20k
25k
30k
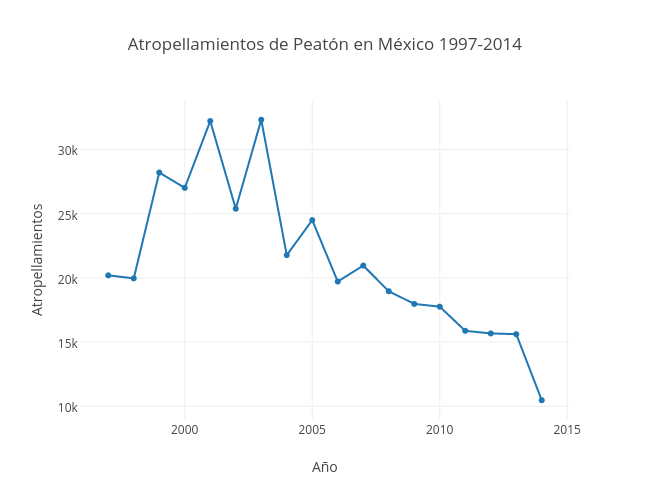
Atropellamientos de Peatón en México 1997-2014
Año
Atropellamientos
plotly-logomark
Edit chart
Jsmanuel.landin's interactive graph and data of "Atropellamientos de Peatón en México 1997-2014" is a scatter chart, showing Atropellamientos; with Año in the x-axis and Atropellamientos in the y-axis.. The x-axis shows values from 1995.8921568627452 to 2015.1078431372548. The y-axis shows values from 8927.034759358288 to 33845.96524064171.