Jan 2000
Mar 2000
May 2000
Jul 2000
Sep 2000
Nov 2000
Jan 2001
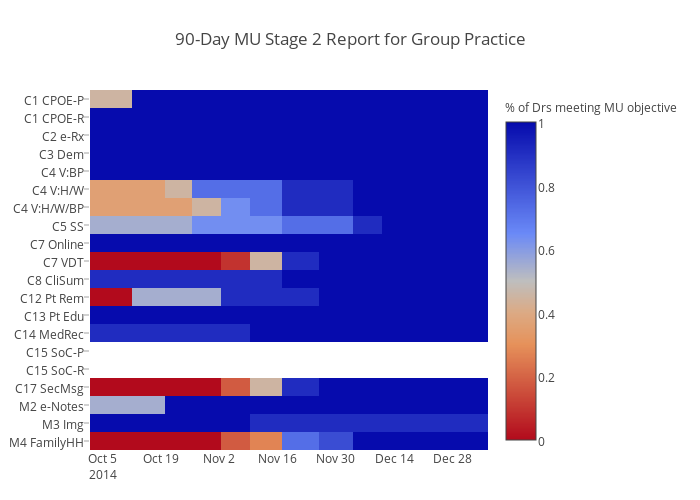
90-Day MU Stage 2 Report for Group Practice
plotly-logomark
Edit chart
Joyrios's interactive graph and data of "90-Day MU Stage 2 Report for Group Practice" is a heatmap, showing Objective; with time in the x-axis. The x-axis shows values from 1412233200000 to 1420488000000. The y-axis shows values from 19.5 to -0.5.