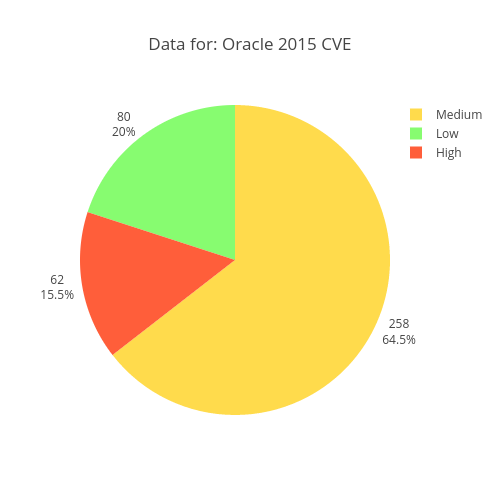
258
64.5%
80
20%
62
15.5%
Medium
Low
High
Data for: Oracle 2015 CVE
plotly-logomark
Edit chart
Joubin's interactive graph and data of "Data for: Oracle 2015 CVE" is a pie. The x-axis shows values from 0 to 0. The y-axis shows values from 0 to 0.