0
2M
4M
6M
8M
10M
30k
40k
50k
60k
70k
80k
0.1
0.15
0.2
0.25
0.3
Percent In Poverty
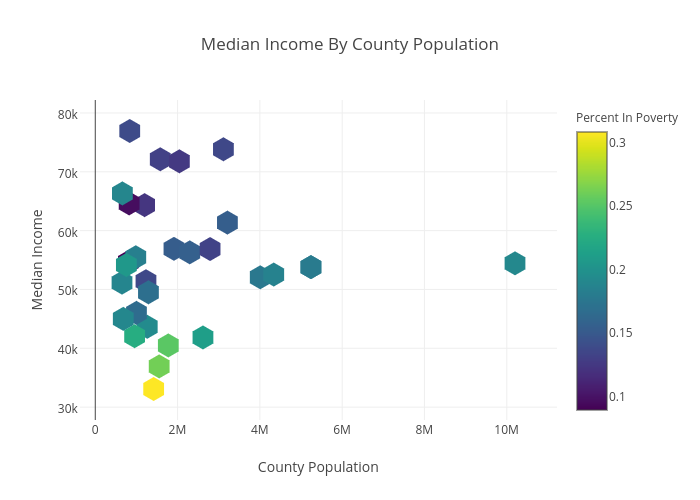
Median Income By County Population
County Population
Median Income
plotly-logomark
Edit chart
Josep2's interactive graph and data of "Median Income By County Population" is a scatter chart, showing y; with County Population in the x-axis and Median Income in the y-axis.. The x-axis shows values from -12518.784782429226 to 10862013.784782428. The y-axis shows values from 29260.741917186613 to 80751.25808281338.