Sweden
Germany
Denmark
United Kingdom
Netherlands
Hungary
Italy
Belgium
Greece
France
20
40
60
80
100
120
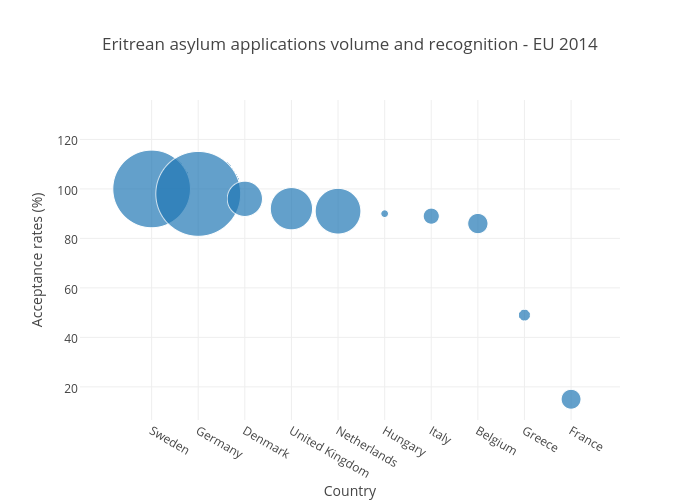
Eritrean asylum applications volume and recognition - EU 2014
Country
Acceptance rates (%)
plotly-logomark
Edit chart
Joedyke's interactive graph and data of "Eritrean asylum applications volume and recognition - EU 2014" is a scatter chart, showing Acceptance rates; with Country in the x-axis and Acceptance rates (%) in the y-axis.. The x-axis shows values from -1.5369235559296153 to 10.050165908692716. The y-axis shows values from 6.612267657947768 to 135.93397363381496.