B
Fit of B
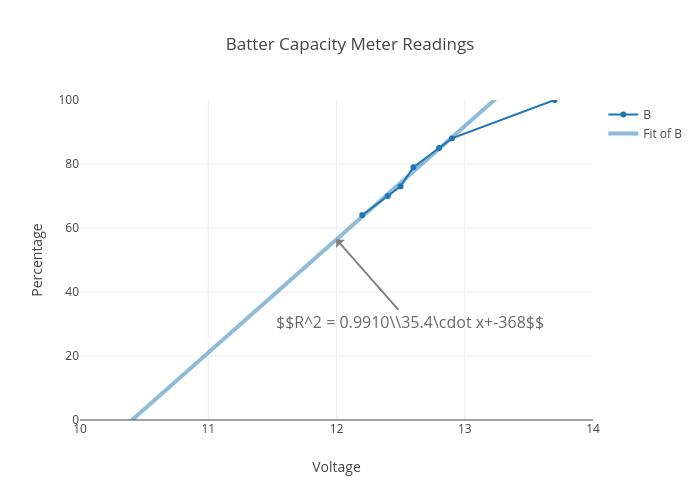
Batter Capacity Meter Readings
$$R^2 = 0.9910\\35.4\cdot x+-368$$
plotly-logomark
Edit chart
Loading graph
Jmehan's interactive graph and data of "Batter Capacity Meter Readings" is a line chart, showing B; with Voltage in the x-axis and Percentage in the y-axis.. The x-axis shows values from 10 to 14. The y-axis shows values from 0 to 100. This visualization has the following annotation: $$R^2 = 0.9910\\35.4\cdot x+-368$$