0
2
4
6
8
10
12
$0
$1
$2
$3
$4
$5
$6
Impulse Response of South Lake Tahoe
to a $1 Increase in Placerville
Months Since Shock
Change in Home Value per Square Foot
plotly-logomark
Edit chart
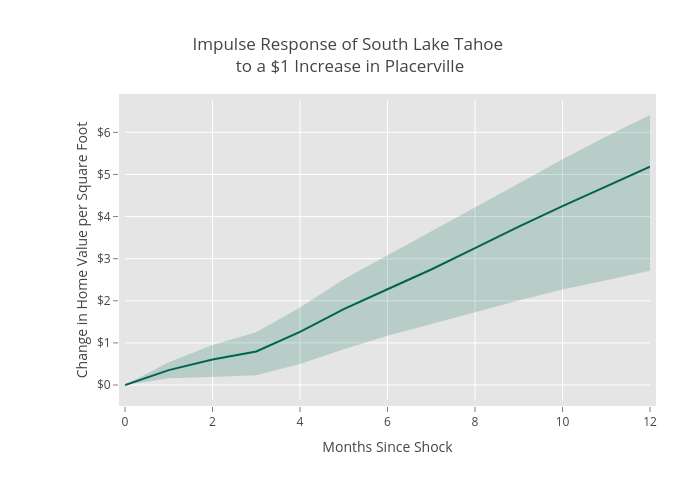
Jkohlhepp's interactive graph and data of "Impulse Response of South Lake Tahoe to a $1 Increase in Placerville" is a line chart, showing Upper Bound, Lower Bound, Average; with Months Since Shock in the x-axis and Change in Home Value per Square Foot in the y-axis.. The x-axis shows values from 0 to 0. The y-axis shows values from 0 to 0.