Wind Capacity
5
10
15
20
25
30
35
40
45
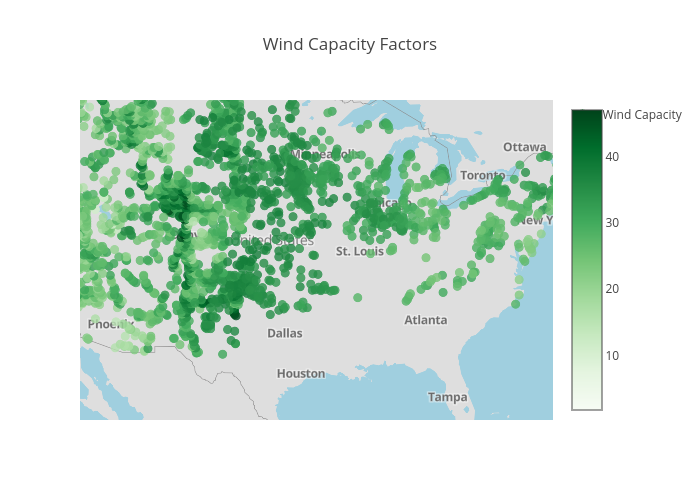
Wind Capacity Factors
plotly-logomark
Edit chart
Loading graph
Jgibson2's interactive graph and data of "Wind Capacity Factors" is a scattermapbox, showing Wind Capacity. The x-axis shows values from 0 to 0. The y-axis shows values from 0 to 0.