1960
1980
2000
0
1000
2000
3000
4000
5000
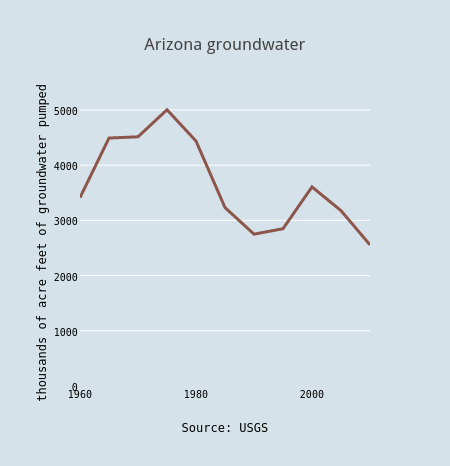
Arizona groundwater
Source: USGS
thousands of acre feet of groundwater pumped
plotly-logomark
Edit chart
Jfleck's interactive graph and data of "Arizona groundwater" is a line chart, showing Groundwater, ag and municipal; with Source: USGS in the x-axis and thousands of acre feet of groundwater pumped in the y-axis.. The x-axis shows values from 1960 to 2010. The y-axis shows values from 0 to 5179.405791316527.