1970
1980
1990
2000
2010
0
50
100
150
200
250
300
350
0
0.5M
1M
1.5M
municipal water use
population
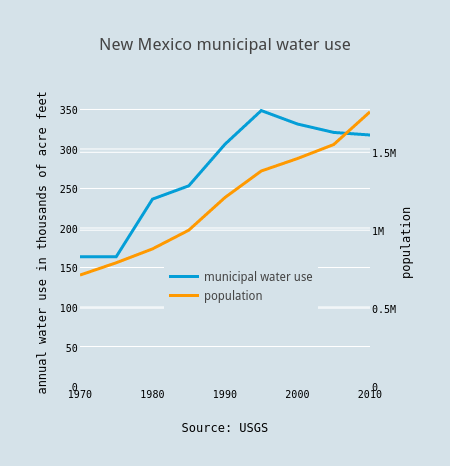
New Mexico municipal water use
Source: USGS
annual water use in thousands of acre feet
population
plotly-logomark
Edit chart
Jfleck's interactive graph and data of "New Mexico municipal water use" is a line chart, showing municipal water use vs population; with Source: USGS in the x-axis and annual water use in thousands of acre feet in the y-axis.. The x-axis shows values from 1970 to 2010. The y-axis shows values from 0 to 361.99081692677066.