1960
1980
2000
100k
200k
300k
400k
500k
600k
700k
Arizona annual cotton acres
year
Arizona cotton acres planted
plotly-logomark
Edit chart
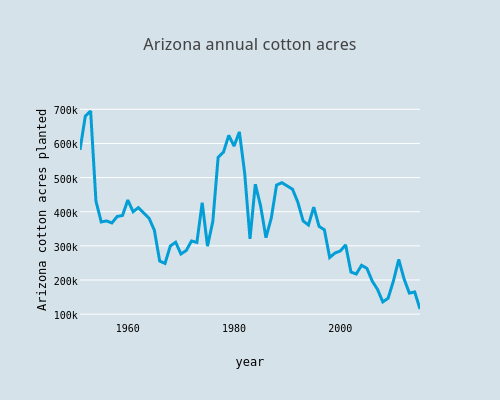
Jfleck's interactive graph and data of "Arizona annual cotton acres" is a scatter chart, showing Arizona cotton acres planted; with year in the x-axis and Arizona cotton acres planted in the y-axis.. The x-axis shows values from 1951 to 2015. The y-axis shows values from 82777.77777777778 to 727222.2222222222.