1960
1980
2000
0
0.5M
1M
1.5M
2M
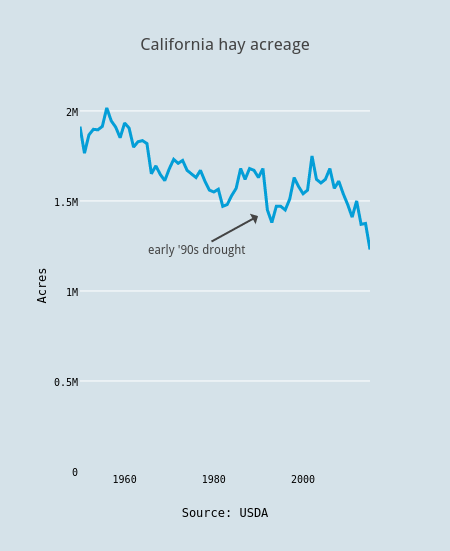
California hay acreage
Source: USDA
Acres
early '90s drought
plotly-logomark
Edit chart
Jfleck's interactive graph and data of "California hay acreage" is a scatter chart, showing Acres; with Source: USDA in the x-axis and Acres in the y-axis.. The x-axis shows values from 1950 to 2015. The y-axis shows values from 0 to 2060722.2222222222. This visualization has the following annotation: early '90s drought