0
0.05
0.1
0.15
0.2
0.25
0.3
0.35
0.4
0
0.2
0.4
0.6
0.8
1
−0.8
−0.6
−0.4
−0.2
0
0.2
0.4
0.6
0.8
Compound Score
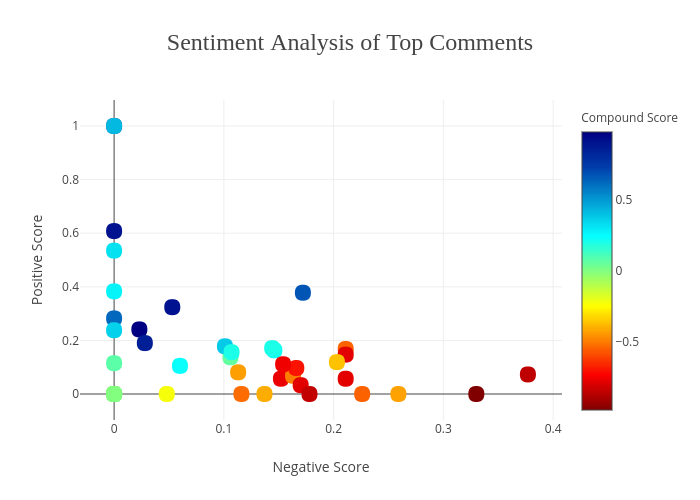
Sentiment Analysis of Top Comments
Negative Score
Positive Score
plotly-logomark
Edit chart
Jesster413's interactive graph and data of "Sentiment Analysis of Top Comments" is a scatter chart; with Negative Score in the x-axis and Positive Score in the y-axis.. The x-axis shows values from -0.02847841726618705 to 0.40547841726618705. The y-axis shows values from -0.09936908517350157 to 1.0993690851735016.