5
15
25
35
45
55
65
75
85
0
2
4
6
8
10
12
14
Survivors
Deceased
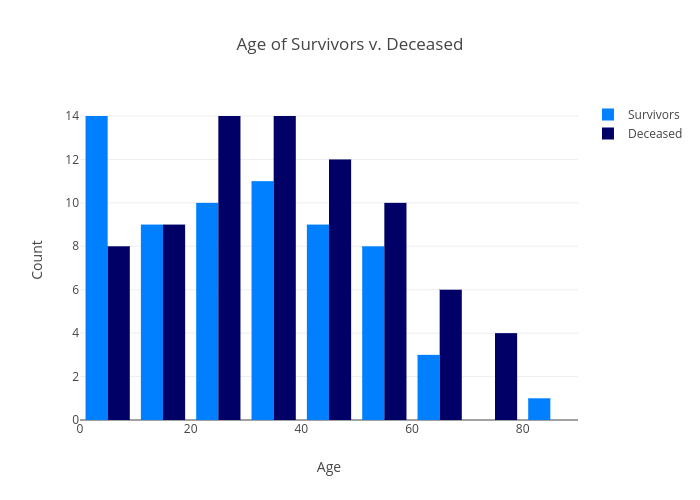
Age of Survivors v. Deceased
Age
Count
plotly-logomark
Edit chart
Jesster413's interactive graph and data of "Age of Survivors v. Deceased" is a histogram, showing Survivors vs Deceased; with Age in the x-axis and Count in the y-axis.. The x-axis shows values from 0 to 91. The y-axis shows values from 0 to 30.