Nov 10
2013
Nov 17
Nov 24
Dec 1
Dec 8
Dec 15
40
42
44
46
48
50
52
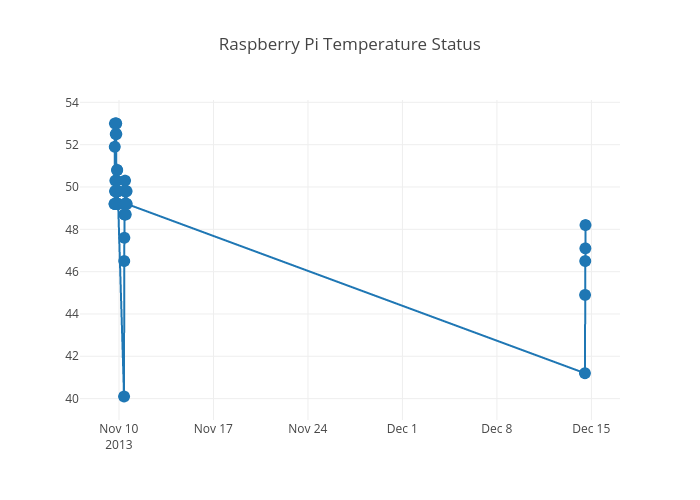
Raspberry Pi Temperature Status
plotly-logomark
Edit chart
Jensb89's interactive graph and data of "Raspberry Pi Temperature Status" is a line chart, showing trace 0. The x-axis shows values from 0 to 0. The y-axis shows values from 0 to 0.