0
20k
40k
60k
80k
100k
2
4
6
8
10
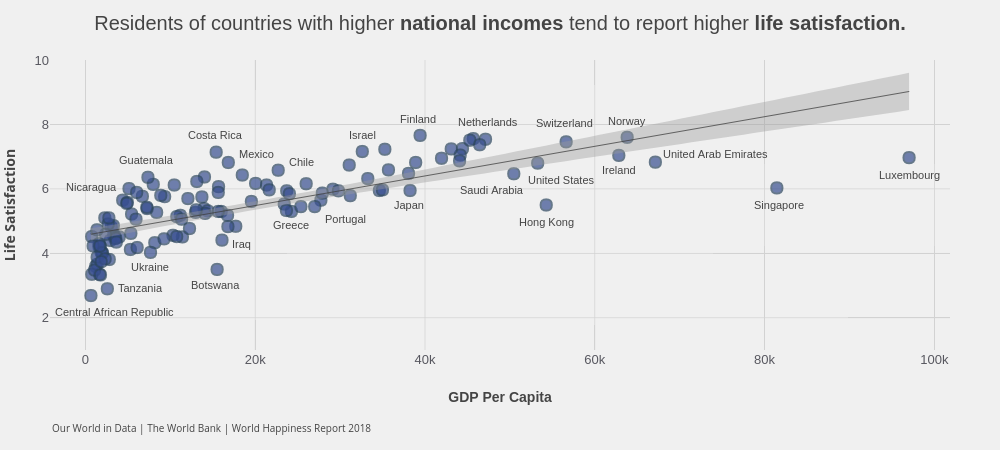
Residents of countries with higher
national incomes
tend to report higher
life satisfaction.
GDP Per Capita
Life Satisfaction
Our World in Data | The World Bank | World Happiness Report 2018
Luxembourg
Singapore
United Arab Emirates
Norway
Switzerland
Ireland
Hong Kong
United States
Saudi Arabia
Netherlands
Finland
Japan
Israel
Central African Republic
Tanzania
Botswana
Guatemala
Nicaragua
Costa Rica
Mexico
Chile
Ukraine
Iraq
Greece
Portugal
plotly-logomark
Edit chart
Jennadevries's interactive graph and data of "Residents of countries with higher national incomes tend to report higher life satisfaction." is a scatter chart, showing fitted values; with GDP Per Capita in the x-axis and Life Satisfaction in the y-axis.. The x-axis shows values from -4170.55 to 101837.55. The y-axis shows values from 1 to 10. This visualization has the following annotations: Our World in Data | The World Bank | World Happiness Report 2018; ; Luxembourg; Singapore; United Arab Emirates; Norway; Switzerland; Ireland; Hong Kong; United States; Saudi Arabia; Netherlands; Finland; Japan; Israel; Central African Republic; Tanzania; Botswana; Guatemala; Nicaragua; Costa Rica; Mexico; Chile; Ukraine; Iraq; Greece; Portugal