1975
1980
1985
1990
1995
2000
2005
2010
2015
10%
20%
30%
40%
50%
Congress
Supreme Court
Newspapers
Presidency
TV News
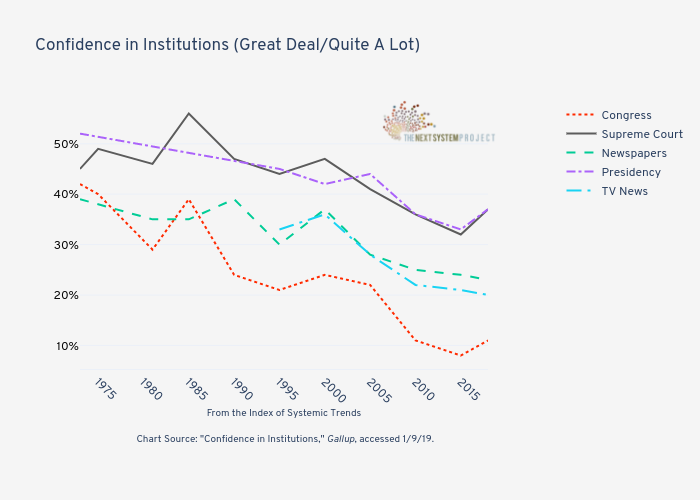
Confidence in Institutions (Great Deal/Quite A Lot)
From the
Index of Systemic Trends
Chart Source:
"Confidence in Institutions,"
Gallup
, accessed 1/9/19.
plotly-logomark
Edit chart
Jduda's interactive graph and data of " Confidence in Institutions (Great Deal/Quite A Lot) " is a line chart, showing Congress, Supreme Court, Newspapers, Presidency, TV News; with From the Index of Systemic Trends Chart Source: "Confidence in Institutions," Gallup, accessed 1/9/19. in the x-axis. The x-axis shows values from 1973 to 2018. The y-axis shows values from 0 to 0.