Japan
Sweden
Denmark
Slovenia
Ireland
Belgium
Austria
France
S. Korea
Spain
England & Wales
Australia
Slovakia
Estonia
Czech Rep.
Chile
Israel
United States
0
100
200
300
400
500
600
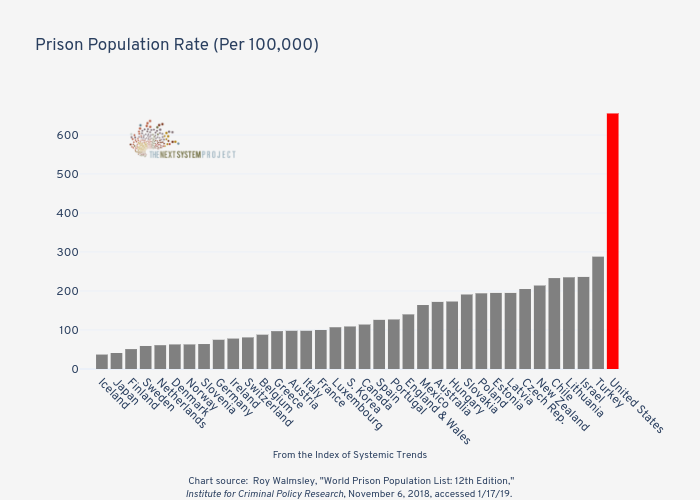
Prison Population Rate (Per 100,000)
From the
Index of Systemic Trends
Chart source: Roy Walmsley,
"World Prison Population List: 12th Edition,"
Institute for Criminal Policy Research
, November 6, 2018, accessed 1/17/19.
plotly-logomark
Edit chart
Jduda's interactive graph and data of " Prison Population Rate (Per 100,000) " is a bar chart, showing ; with From the Index of Systemic Trends Chart source: Roy Walmsley, "World Prison Population List: 12th Edition," Institute for Criminal Policy Research, November 6, 2018, accessed 1/17/19. in the x-axis and in the y-axis.. The x-axis shows values from -0.5 to 36.5. The y-axis shows values from 0 to 689.4736842105264.