1970
1975
1980
1985
1990
1995
2000
2005
2010
2015
60%
70%
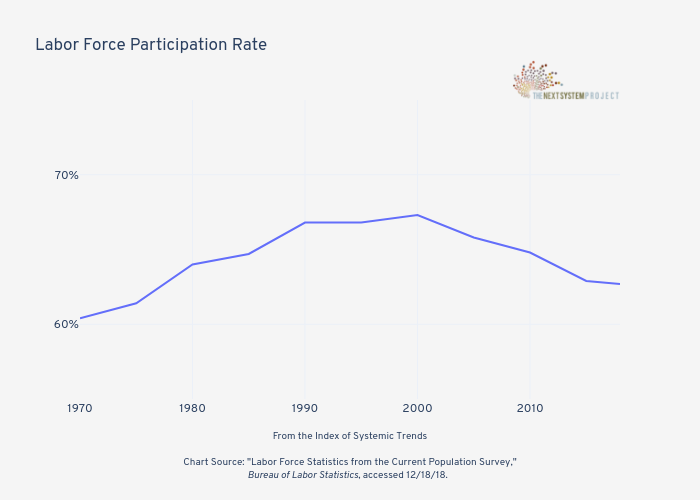
Labor Force Participation Rate
From the
Index of Systemic Trends
Chart Source: "Labor Force Statistics from the Current Population Survey,"
Bureau of Labor Statistics
, accessed 12/18/18.
plotly-logomark
Edit chart
Jduda's interactive graph and data of " Labor Force Participation Rate " is a line chart; with From the Index of Systemic Trends Chart Source: "Labor Force Statistics from the Current Population Survey," Bureau of Labor Statistics, accessed 12/18/18. in the x-axis. The x-axis shows values from 1970 to 2018. The y-axis shows values from 55 to 75.