1970
1975
1980
1985
1990
1995
2000
2005
2010
2015
30%
35%
40%
45%
50%
55%
60%
65%
70%
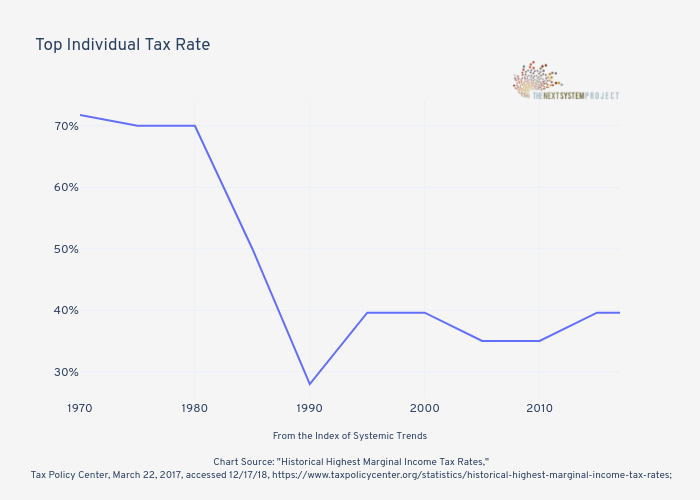
Top Individual Tax Rate
From the
Index of Systemic Trends
Chart Source: "Historical Highest Marginal Income Tax Rates,"
Tax Policy Center, March 22, 2017, accessed 12/17/18, https://www.taxpolicycenter.org/statistics/historical-highest-marginal-income-tax-rates;
plotly-logomark
Edit chart
Jduda's interactive graph and data of "Top Individual Tax Rate" is a line chart; with From the Index of Systemic Trends Chart Source: "Historical Highest Marginal Income Tax Rates," Tax Policy Center, March 22, 2017, accessed 12/17/18, https://www.taxpolicycenter.org/statistics/historical-highest-marginal-income-tax-rates; in the x-axis. The x-axis shows values from 1970 to 2017. The y-axis shows values from 25.569444444444443 to 74.18055555555556.