1970
1980
1990
2000
2010
$0/hr
$5/hr
$10/hr
$15/hr
$20/hr
$25/hr
Nominal
Real (2018 dollars)
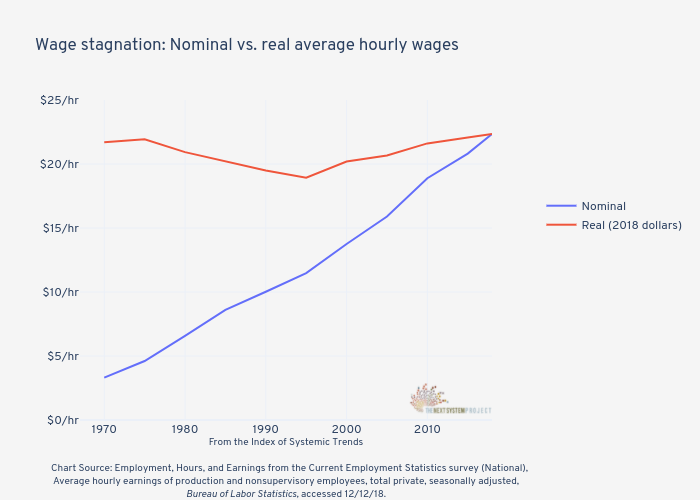
Wage stagnation: Nominal vs. real average hourly wages
From the
Index of Systemic Trends
Chart Source: Employment, Hours, and Earnings from the Current Employment Statistics survey (National),
Average hourly earnings of production and nonsupervisory employees, total private, seasonally adjusted,
Bureau of Labor Statistics,
accessed 12/12/18.
plotly-logomark
Edit chart
Jduda's interactive graph and data of "Wage stagnation: Nominal vs. real average hourly wages" is a line chart, showing Nominal vs Real (2018 dollars); with From the Index of Systemic Trends Chart Source: Employment, Hours, and Earnings from the Current Employment Statistics survey (National), Average hourly earnings of production and nonsupervisory employees, total private, seasonally adjusted, Bureau of Labor Statistics, accessed 12/12/18. in the x-axis. The x-axis shows values from 1967 to 2018. The y-axis shows values from 0 to 25.