1970
1980
1990
2000
2010
0%
5%
10%
15%
20%
Top 1%
Bottom 50%
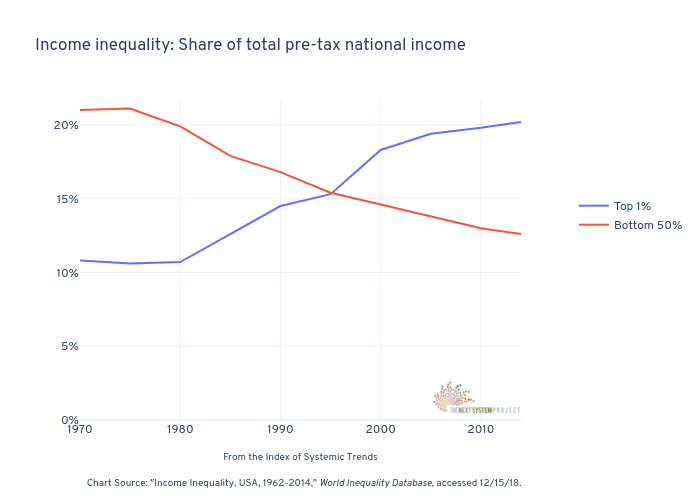
Income inequality: Share of total pre-tax national income
From the
Index of Systemic Trends
Chart Source: "Income Inequality, USA, 1962-2014,"
World Inequality Database
, accessed 12/15/18.
plotly-logomark
Edit chart
Jduda's interactive graph and data of "Income inequality: Share of total pre-tax national income" is a line chart, showing Top 1% vs Bottom 50%; with From the Index of Systemic Trends Chart Source: "Income Inequality, USA, 1962-2014," World Inequality Database, accessed 12/15/18. in the x-axis. The x-axis shows values from 1970 to 2014. The y-axis shows values from 0 to 21.683333333333334.