1975
1980
1985
1990
1995
2000
2005
8%
10%
12%
14%
16%
18%
20%
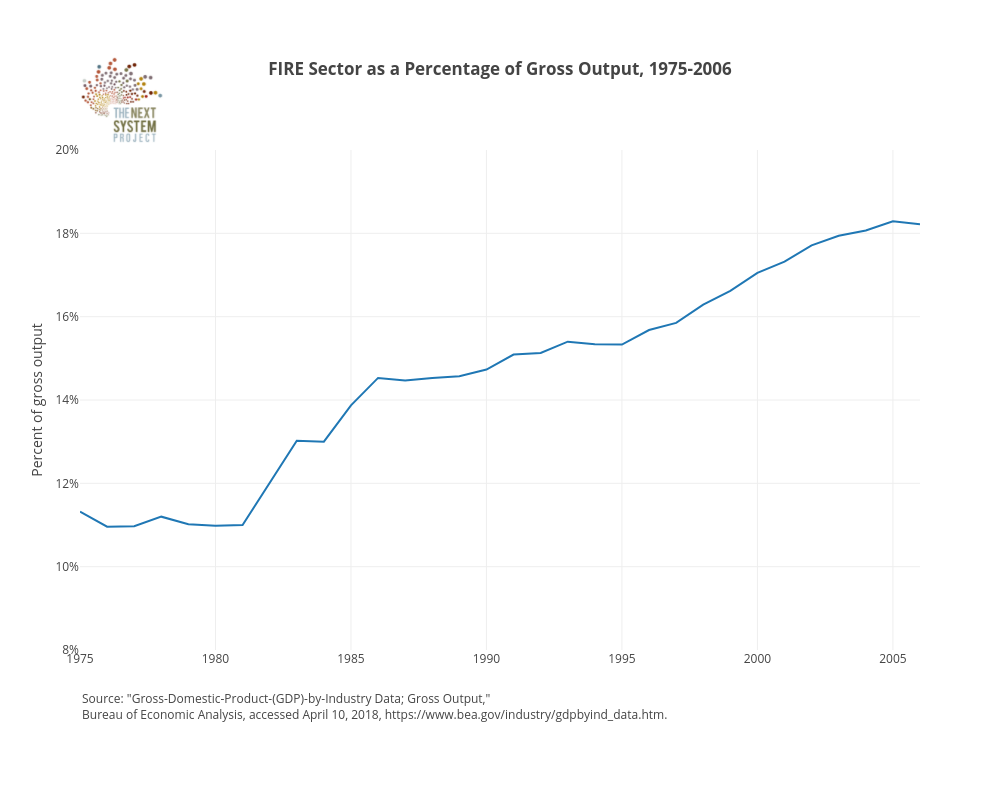
FIRE Sector as a Percentage of Gross Output, 1975-2006
Percent of gross output
Source: "Gross-Domestic-Product-(GDP)-by-Industry Data; Gross Output,"
Bureau of Economic Analysis, accessed April 10, 2018,
https://www.bea.gov/industry/gdpbyind_data.htm
.
plotly-logomark
Edit chart
Jduda's interactive graph and data of "FIRE Sector as a Percentage of Gross Output, 1975-2006" is a line chart, showing %; with Percent of gross output in the y-axis. The x-axis shows values from 1975 to 2006. The y-axis shows values from 8 to 20. This visualization has the following annotation: Source: "Gross-Domestic-Product-(GDP)-by-Industry Data; Gross Output," Bureau of Economic Analysis, accessed April 10, 2018, https://www.bea.gov/industry/gdpbyind_data.htm.