1
1.5
2
2.5
3
3.5
4
1
1.5
2
2.5
3
3.5
4
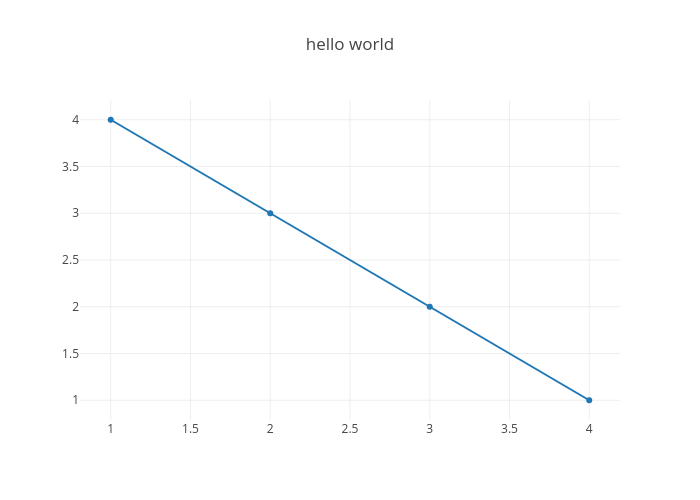
hello world
plotly-logomark
Edit chart
Jasmin.c.johnson's interactive graph and data of "hello world" is a scatter chart. The x-axis shows values from 0 to 0. The y-axis shows values from 0 to 0.