0 stations
1 stations
2 stations
3 stations
4 stations
5 stations
$20,000
$40,000
$60,000
$80,000
$100,000
$120,000
$140,000
$160,000
Census tract
Median tract within column
Number of Divvy stations in census tract
Median household income of census tract
plotly-logomark
Edit chart
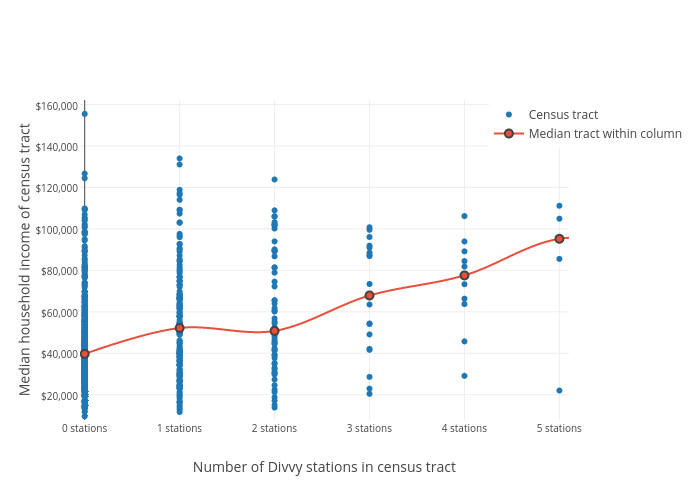
Janbinder's interactive graph and data of "Median household income of census tract vs Number of Divvy stations in census tract" is a scatter chart, showing Census tract vs Median tract within column; with Number of Divvy stations in census tract in the x-axis and Median household income of census tract in the y-axis.. The x-axis shows values from -0.04938852304797747 to 5.101128880526812. The y-axis shows values from 7793.056968463885 to 162206.07833163784.