2013
2014
2015
2016
2017
2018
2019
0
500
1000
1500
China
France
Italy
Germany
Kingdom
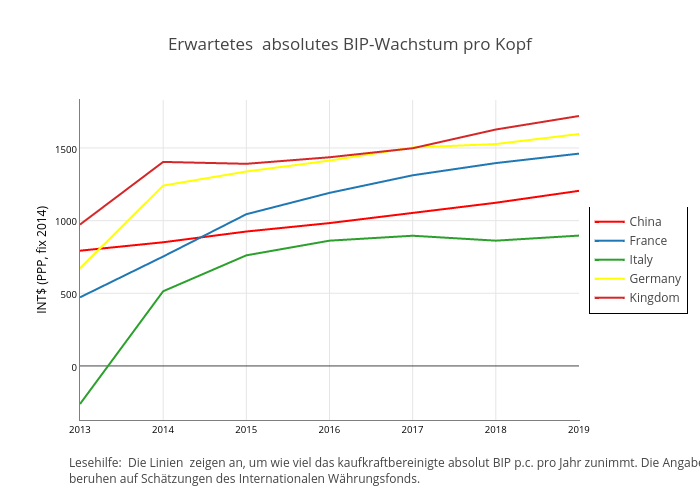
Erwartetes absolutes BIP-Wachstum pro Kopf
INT$ (PPP, fix 2014)
Lesehilfe: Die Linien zeigen an, um wie viel das kaufkraftbereinigte absolut BIP p.c. pro Jahr zunimmt. Die Angaben
beruhen auf Schätzungen des Internationalen Währungsfonds.
plotly-logomark
Edit chart
Jamshed's interactive graph and data of "Erwartetes absolutes BIP-Wachstum pro Kopf" is a line chart, showing China, France, Italy, Germany, Kingdom; with INT$ (PPP, fix 2014) in the y-axis. The x-axis shows values from 2013 to 2019. The y-axis shows values from -372.1111111111111 to 1830.111111111111. This visualization has the following annotations: Lesehilfe: Die Linien zeigen an, um wie viel das kaufkraftbereinigte absolut BIP p.c. pro Jahr zunimmt. Die Angaben ; beruhen auf Schätzungen des Internationalen Währungsfonds.