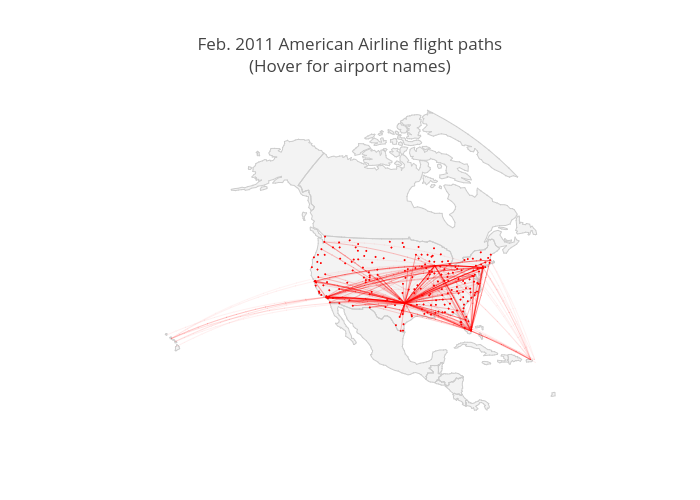
Feb. 2011 American Airline flight paths
(Hover for airport names)
plotly-logomark
Edit chart
Loading graph
Jackp's interactive graph and data of "Feb. 2011 American Airline flight paths(Hover for airport names)" is a scattergeo. The x-axis shows values from 0 to 0. The y-axis shows values from 0 to 0.