World Average
World Average
COLDER & SHORTER
COLDER & TALLER
HOTTER & SHORTER
HOTTER & TALLER
Russian Federation
Canada
Finland
United States
China
India
Afghanistan
Australia
Korea, Rep.
Netherlands
−10
−5
0
5
10
15
20
25
30
150
155
160
165
170
175
180
185
190
Low income
Upper middle income
High income
Lower middle income
Average Annual Temperature, C
Average Male Height, cm
plotly-logomark
Edit chart
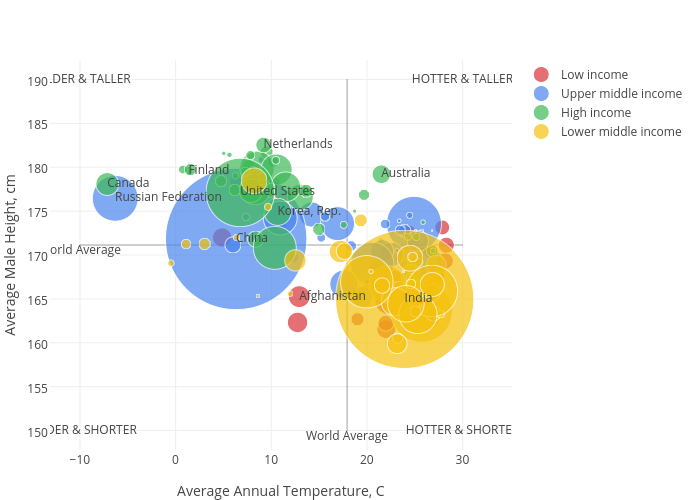
Ivanku's interactive graph and data of "Average Male Height, cm vs Average Annual Temperature, C" is a , showing Low income, Upper middle income, High income, Lower middle income; with Average Annual Temperature, C in the x-axis and Average Male Height, cm in the y-axis.. The x-axis shows values from 0 to 0. The y-axis shows values from 0 to 0.