Norway
Switzerland
Venezuela
Sweden
Brazil
Finland
Canada
France
Italy
Denmark
Israel
Belgium
Euro area
New Zealand
Germany
Britain
Uruguay
Spain
Australia
United States
Ireland
Colombia
Netherlands
Austria
Turkey
Greece
Portugal
South Korea
Costa Rica
Estonia
Singapore
Hungary
Chile
Philippines
Japan
Peru
UAE
Lithuania
Czech Republic
Mexico
Thailand
Pakistan
Poland
Saudi Arabia
Vietnam
China
Sri Lanka
Taiwan
Argentina
Russia
Indonesia
Hong Kong
Malaysia
Egypt
South Africa
India
Ukraine
−60
−40
−20
0
20
40
60
Valuation
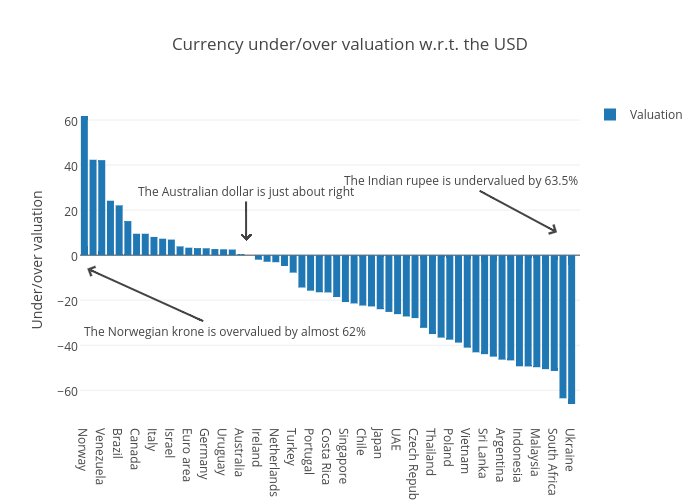
Currency under/over valuation w.r.t. the USD
Under/over valuation
The Indian rupee is undervalued by 63.5%
The Australian dollar is just about right
The Norwegian krone is overvalued by almost 62%
plotly-logomark
Edit chart
Isnerd's interactive graph and data of "Currency under/over valuation w.r.t. the USD" is a bar chart, showing Valuation; with Under/over valuation in the y-axis. The x-axis shows values from -0.5 to 56.5. The y-axis shows values from -73.19444444444444 to 68.89444444444445. This visualization has the following annotations: The Indian rupee is undervalued by 63.5%; The Australian dollar is just about right; The Norwegian krone is overvalued by almost 62%