0
1B
2B
3B
4B
5B
6B
7B
8B
BARMM
REGION X
REGION IX
REGION XII
MIMAROPA
REGION VI
REGION VIII
CAR
REGION XI
REGION V
REGION VII
REGION II
CARAGA
REGION I
REGION III
NCR
CALABARZON
OTHERS
NGO
LGU
DSWD
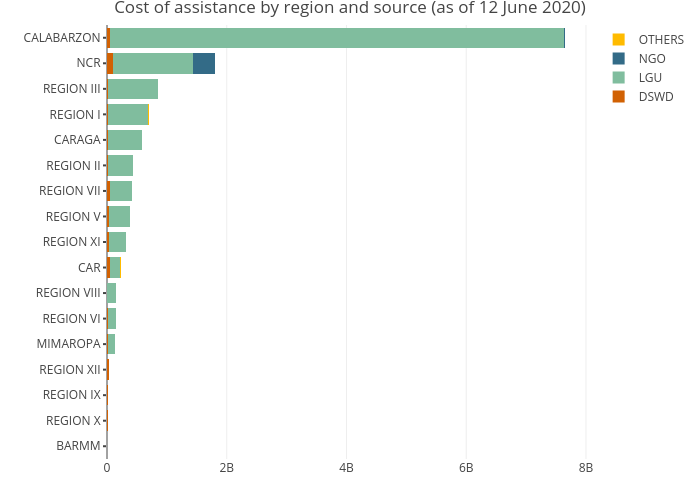
Cost of assistance by region and source (as of 12 June 2020)
plotly-logomark
Edit chart
Hey.sue.go's interactive graph and data of "Cost of assistance by region and source (as of 12 June 2020)" is a stacked bar chart, showing DSWD, LGU, NGO, OTHERS. The x-axis shows values from 0 to 0. The y-axis shows values from 0 to 0.