0
0.5M
1M
1.5M
2M
2.5M
3M
0
100
200
300
400
500
600
700
800
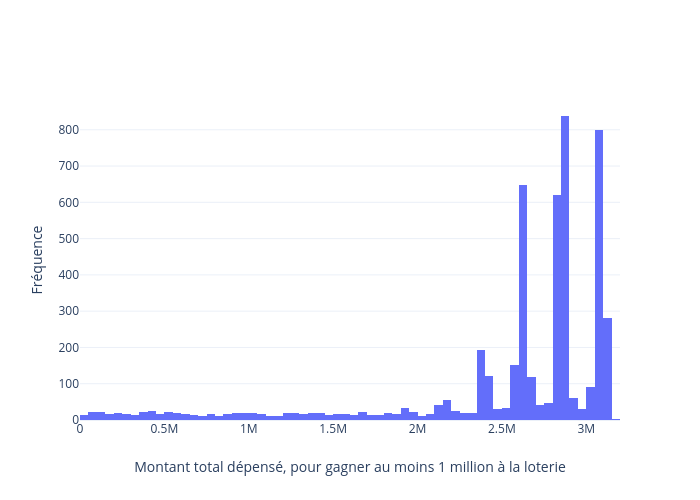
Montant total dépensé, pour gagner au moins 1 million à la loterie
Fréquence
plotly-logomark
Edit chart
Helenebecotte's interactive graph and data of "Fréquence vs Montant total dépensé, pour gagner au moins 1 million à la loterie" is a histogram; with Montant total dépensé, pour gagner au moins 1 million à la loterie in the x-axis and Fréquence in the y-axis.. The x-axis shows values from -0.5 to 3199999.5. The y-axis shows values from 0 to 882.1052631578948.