8am
9am
10am
11am
12pm
1pm
2pm
3pm
4pm
5pm
Hopkins
Pangea
Torrey Pines Center South
Torrey Pines Center North
Gilman
East Campus 1 East
East Campus 1 West
Bachman
140 Arbor
0
50
100
150
200
250
300
350
400
plotly-logomark
Edit chart
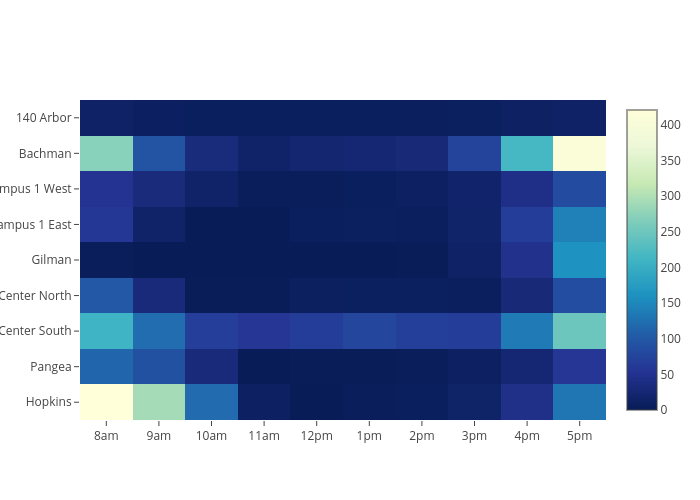
Hali96's interactive graph and data is a heatmap. The x-axis shows values from 0 to 0. The y-axis shows values from 0 to 0.