2009
2010
2011
2012
2013
2014E
2015E
2016E
2017E
0
20
40
60
80
100
ROW
Japan
China
U.S.
EU
Percent of Annual Installed Capacity
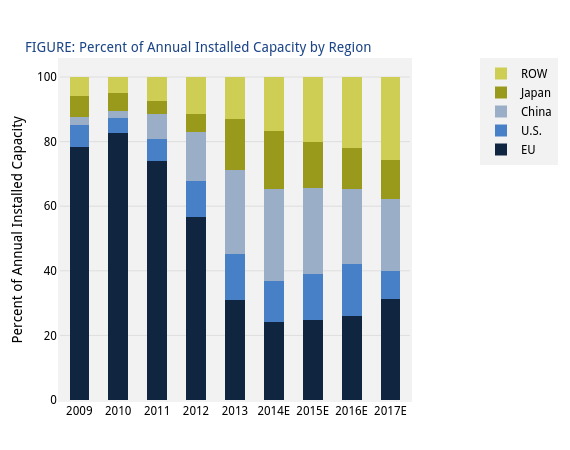
FIGURE: Percent of Annual Installed Capacity by Region
plotly-logomark
Edit chart
Greentechmedia's interactive graph and data of "EU, U.S., China, Japan, ROW" is a stacked bar chart, showing EU, U.S., China, Japan, ROW; with Percent of Annual Installed Capacity in the y-axis. The x-axis shows values from -0.5 to 8.5. The y-axis shows values from 0 to 105.26315789473688. This visualization has the following annotation: FIGURE: Percent of Annual Installed Capacity by Region