Q4 2008
Q4 2009
Q4 2010
Q4 2011
Q4 2012
Q4 2013E
0
20
40
60
80
100
Non-Silicon
Silicon
Percent
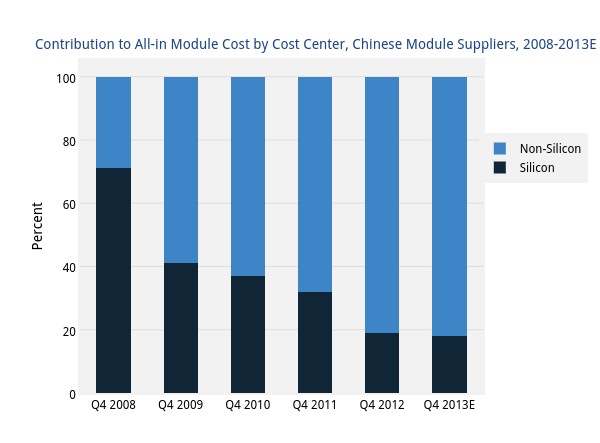
Contribution to All-in Module Cost by Cost Center, Chinese Module Suppliers, 2008-2013E
plotly-logomark
Edit chart
Greentechmedia's interactive graph and data of "Silicon vs Non-Silicon" is a stacked bar chart, showing Silicon vs Non-Silicon; with Percent in the y-axis. The x-axis shows values from -0.5 to 5.5. The y-axis shows values from 0 to 105.26315789473685. This visualization has the following annotation: Contribution to All-in Module Cost by Cost Center, Chinese Module Suppliers, 2008-2013E