2006
2007
2008
2009
2010
2011
2012
2013E
2014E
2015E
2016E
0
10
20
30
40
50
60
70
80
90
Minutes Per Installation
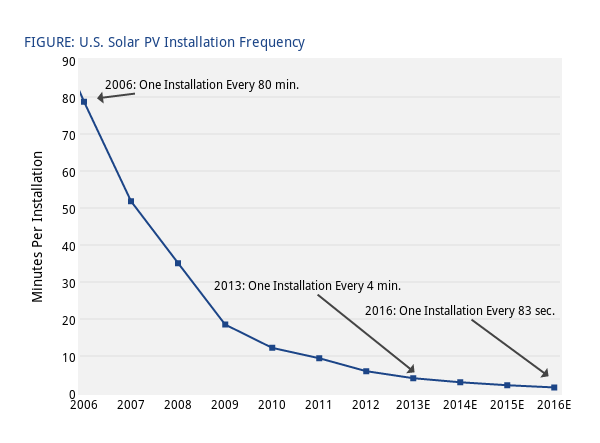
FIGURE: U.S. Solar PV Installation Frequency
2016: One Installation Every 83 sec.
2013: One Installation Every 4 min.
2006: One Installation Every 80 min.
plotly-logomark
Edit chart
Greentechmedia's interactive graph and data of "Minutes/Installation_y" is a scatter chart, showing Minutes/Installation_y; with Minutes Per Installation in the y-axis. The x-axis shows values from 4.913194444444445 to 15.121527777777779. The y-axis shows values from 0 to 90. This visualization has the following annotations: FIGURE: U.S. Solar PV Installation Frequency; 2016: One Installation Every 83 sec.; 2013: One Installation Every 4 min.; 2006: One Installation Every 80 min.