2000
2001
2002
2003
2004
2005
2006
2007
2008
2009
2010
2011
2012
2013
2014
0
5M
10M
15M
20M
Firearm Background Checks
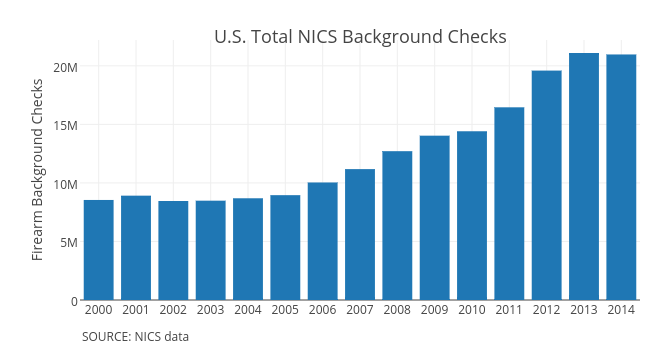
U.S. Total NICS Background Checks
SOURCE: NICS data
plotly-logomark
Edit chart
Governing's interactive graph and data of "Firearm Background Checks" is a bar chart, showing Firearm Background Checks; with Firearm Background Checks in the y-axis. The x-axis shows values from -0.5 to 14.5. The y-axis shows values from 0 to 22203445.263157897. This visualization has the following annotations: U.S. Total NICS Background Checks; SOURCE: NICS data