2000
2005
2010
2015
$0
$20M
$40M
$60M
$80M
$100M
Annual Lobbying Spending
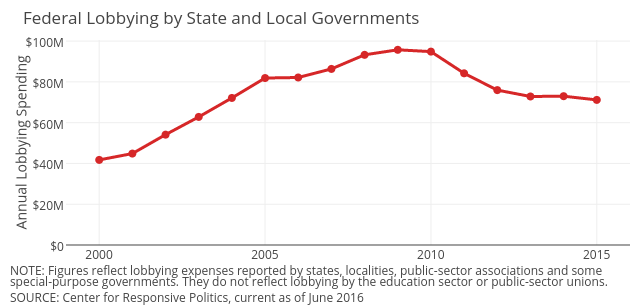
NOTE: Figures reflect lobbying expenses reported by states, localities, public-sector associations and some
special-purpose governments. They do not reflect lobbying by the education sector or public-sector unions.
SOURCE: Center for Responsive Politics, current as of June 2016
Federal Lobbying by State and Local Governments
plotly-logomark
Edit chart
Governing's interactive graph and data of "B" is a line chart, showing B; with Annual Lobbying Spending in the y-axis. The x-axis shows values from 1998.9991961414792 to 2016.0008038585208. The y-axis shows values from 0 to 100535585.79003021. This visualization has the following annotations: NOTE: Figures reflect lobbying expenses reported by states, localities, public-sector associations and some ; special-purpose governments. They do not reflect lobbying by the education sector or public-sector unions.; SOURCE: Center for Responsive Politics, current as of June 2016; Federal Lobbying by State and Local Governments