2000
2001
2002
2003
2004
2005
2006
2007
2008
2009
2010
2011
2012
2013
2014
0
200
400
600
800
Annual Total
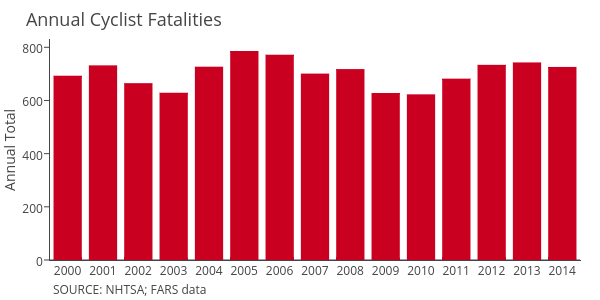
SOURCE: NHTSA; FARS data
Annual Cyclist Fatalities
plotly-logomark
Edit chart
Governing's interactive graph and data of "Col1" is a bar chart, showing Col1; with Annual Total in the y-axis. The x-axis shows values from 1999.5 to 2014.5. The y-axis shows values from 0 to 827.3684210526316. This visualization has the following annotations: SOURCE: NHTSA; FARS data; Annual Cyclist Fatalities