0.5
1
1.5
2
2.5
3
0
5k
10k
15k
20k
I1
SI2
SI1
VS2
VS1
VVS2
VVS1
IF
carat
price
plotly-logomark
Edit chart
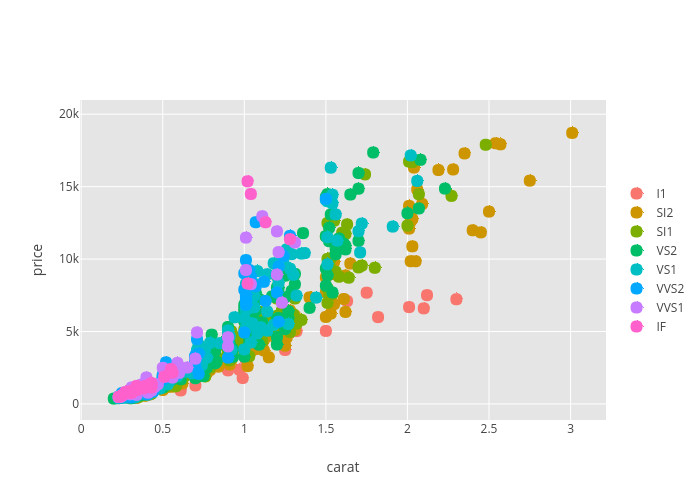
Ggplot2examples's interactive graph and data of "price vs carat" is a scatter chart, showing I1, SI2, SI1, VS2, VS1, VVS2, VVS1, IF; with carat in the x-axis and price in the y-axis.. The x-axis shows values from 0.021010536398467422 to 3.1889894636015326. The y-axis shows values from -1109.4413524835427 to 20983.613432348622.