00:00
Feb 3, 2015
03:00
06:00
09:00
12:00
15:00
18:00
21:00
0
1000
2000
3000
4000
5000
USED WATTS
GENERATED WATTS
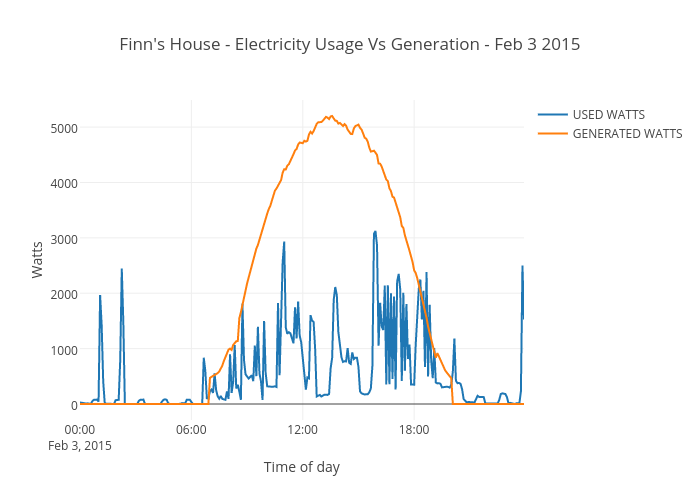
Finn's House - Electricity Usage Vs Generation - Feb 3 2015
Time of day
Watts
plotly-logomark
Edit chart
Finipi's interactive graph and data of "Finn's House - Electricity Usage Vs Generation - Feb 3 2015" is a scatter chart, showing USED WATTS vs GENERATED WATTS; with Time of day in the x-axis and Watts in the y-axis.. The x-axis shows values from 1422883800000 to 1422969900000. The y-axis shows values from -288.8888888888887 to 5488.888888888889.