Altersgruppe
bis 39
40+
50+
60+
0
500
1000
1500
2000
CVP
FDP
SP
SVP
Durchschnittliche Tweets nach Partei und Altersgruppe
Altersgruppen
Durchschnittliche Anzahl Tweets
plotly-logomark
Edit chart
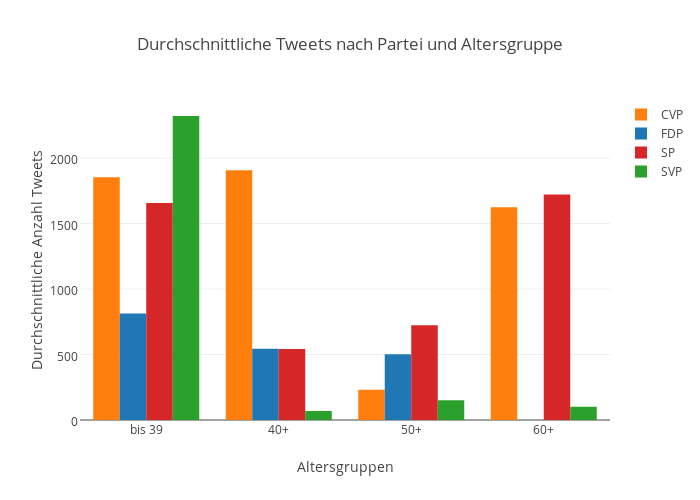
Egloff.mario's interactive graph and data of "Durchschnittliche Tweets nach Partei und Altersgruppe" is a bar chart, showing CVP, FDP, SP, SVP; with Altersgruppen in the x-axis and Durchschnittliche Anzahl Tweets in the y-axis.. The x-axis shows values from 0.5 to 4.5. The y-axis shows values from 0 to 2443.157894736842.